How the Biodiversity Metric Works: A Plain-English Guide for Developers
Biodiversity Net Gain has been mandatory for most planning applications in England since February 2024, and yet the biodiversity metric – the tool used to calculate whether a development achieves the required 10% gain – remains poorly understood by a lot of the people who need to use it. Not the ecologists. The developers, the planning managers, the project directors who need to understand what number they’re working towards and whether their scheme is going to get there.
That gap matters. If you don’t understand what the metric is measuring, you can’t make informed decisions about site layout, habitat retention, or whether off-site units are going to be needed. You end up dependent on whoever is running the ecological assessment to tell you what you need to do, without the context to push back sensibly or to make design decisions that actually improve the outcome.
So. Here’s what the metric is, how it works, and what the numbers mean.
The Basic Principle
The biodiversity metric – currently Natural England’s Biodiversity Metric 4.0, though version numbers have incremented since the original – is a spreadsheet-based tool that assigns a biodiversity unit value to parcels of habitat. The unit value of a habitat is calculated from three things: its area (or length, for linear habitats like hedgerows), its type or distinctiveness, and its condition.
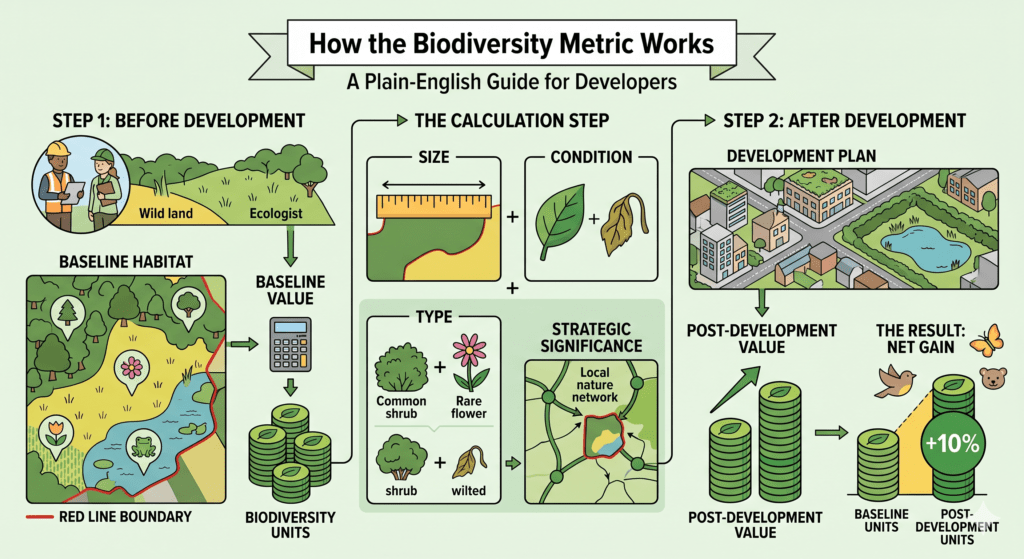
You calculate the total unit value of all habitats on the site before development – the pre-development baseline. Then you calculate the unit value of all habitats that will exist on the site after development – accounting for what’s been lost, what’s been retained, and what new habitat is being created. The post-development total needs to be at least 10% higher than the pre-development baseline. If it isn’t, the shortfall needs to be made up through off-site habitat creation.
That’s the whole principle. The complexity is in how area, distinctiveness, and condition interact, and in the multipliers the metric applies to account for spatial risk and time.
Distinctiveness – What Kind of Habitat Is It?
Habitat distinctiveness is a fixed property of the habitat type – it’s assigned by Natural England based on the broad habitat category and doesn’t change with condition. Higher distinctiveness habitats are rarer, harder to create or replace, and carry more weight in the metric. Here’s a rough sense of the range:
| Distinctiveness Level | Score | Example Habitats |
|---|---|---|
| Very high | 8 | Ancient woodland, blanket bog, saltmarsh, ancient and veteran trees |
| High | 6 | Traditional orchard, lowland meadow, lowland heath, fen, coastal habitats |
| Medium | 4 | Hedgerow, woodland (not ancient), neutral grassland, rivers and streams |
| Low | 2 | Improved grassland, scrub, standing water (standard), arable field margins |
| Very low | 1 | Introduced shrub, bare ground, introduced grass |
| N/A | 0 | Sealed surface (tarmac, concrete), buildings |
The practical implication of distinctiveness scoring is significant: losing high-distinctiveness habitat is very difficult to compensate for within the metric, because the replacement habitat needs to be of the same or higher distinctiveness to generate equivalent units. Destroying a patch of lowland meadow (distinctiveness 6) and replacing it with neutral grassland (distinctiveness 4) produces a unit deficit even if the replacement area is considerably larger than what was lost. This is why the metric strongly discourages development that impacts high-distinctiveness habitats.
Condition – How Good Is the Habitat?
Condition is where the metric gets nuanced, and where management decisions make a direct difference to the unit value of a habitat. Condition is assessed against standardised criteria for each habitat type – different criteria for grassland than for woodland, different again for hedgerows or wetlands – and classified as Poor, Moderate, Good, or Fairly Good (the last being a category that sits between Moderate and Good for some habitats).
Each condition class carries a multiplier. Poor condition habitats generate fewer units per unit area than those in moderate or good condition. A hectare of good condition neutral grassland generates more biodiversity units than the same area of poor condition neutral grassland, even though the distinctiveness score is identical.
Here’s why this matters for development planning: the pre-development baseline includes the condition of existing habitats as they are now. A site covered in poor condition grassland has a low baseline, which makes achieving 10% gain relatively straightforward. A site with good condition habitats has a high baseline, which makes the gain requirement harder to meet within the development footprint. Developers sometimes assume that a site with existing ecological interest will be easier to navigate for BNG – in practice, it can be harder, because the baseline is higher.
The Time Multiplier – Why New Habitat Is Discounted
New habitat created as part of a BNG scheme isn’t credited at its full potential unit value immediately. The metric applies a time multiplier that discounts the value of newly created habitat to account for the delay between creation and that habitat reaching its target condition. A species-rich grassland that’s sown today won’t reach good condition for years – the metric reflects that by discounting the units generated by newly created habitat according to how long it will take to reach the assessed condition.
The discount is applied through a “habitat creation or enhancement” category in the metric spreadsheet. Newly created habitat is entered at its target condition, then a temporal discount factor reduces the unit value depending on the estimated time to reach that condition. Grassland creation might be assessed as taking five to ten years; woodland planting considerably longer. The longer the time to condition, the greater the discount – which is why habitat types that establish quickly can be more efficient in the metric than those that take decades to mature.
This is also part of why the 30-year management commitment exists. The metric credits the habitat at its target condition – but only if the management commitment is in place to ensure it reaches and maintains that condition over time. Without the management commitment, the discounted unit value can’t be claimed.
The Spatial Risk Multiplier
On-site habitat creation and retention generates units at full value. Off-site habitat creation is subject to a spatial risk multiplier that reduces the unit value credited – the further the off-site habitat is from the development, the lower the multiplier, reflecting the reduced ecological connectivity benefit of distant habitat to the development site and its surroundings.
Strategic significance also affects the multiplier. Habitat located in an area identified as strategically important for nature recovery – aligning with Local Nature Recovery Strategy priorities – receives a higher multiplier than equivalent habitat in a less strategically significant location. This is the mechanism by which the metric tries to incentivise habitat creation where it does the most ecological good at a landscape scale, rather than just wherever land is cheapest.
Our biodiversity metric assessment services work through both the pre-development baseline and the post-development scenario, identifying where the most efficient gains can be achieved within the development footprint and what off-site contribution is likely to be needed – before those decisions are locked into the scheme design rather than after.
Irreplaceability – The Habitats That Can’t Be Traded
Some habitat types sit outside the normal metric trading framework entirely. Ancient woodland, ancient and veteran trees, and a small number of other irreplaceable habitats cannot be offset through biodiversity unit generation elsewhere. Their loss is considered unacceptable regardless of the unit arithmetic, and the National Planning Policy Framework maintains a strong presumption against development that results in their loss or deterioration.
In practice, this means that if a development site contains ancient woodland or veteran trees, those features need to be designed around rather than written out of the BNG calculation. The metric will flag them, but the planning system’s response to their presence goes beyond the metric – they attract a level of protection that no amount of off-site habitat creation can compensate for.
Running the Numbers – What the Spreadsheet Produces
The metric spreadsheet – freely available from Natural England – takes all of the above inputs and produces a summary of pre-development biodiversity units, post-development biodiversity units from retained habitat, post-development units from enhanced or created habitat, the net change in units, and whether the 10% gain requirement is met. It separates habitat units from hedgerow units and watercourse units, which are calculated slightly differently using linear rather than area-based measures.
The output is a number – the biodiversity unit surplus or deficit – and a percentage gain figure. For planning purposes, that output and the assumptions behind it need to be submitted alongside the planning application as part of the BNG statement. Local planning authorities and their ecological consultees will check the metric calculation, and errors or unjustifiable assumptions will come back as queries that delay determination.
Common errors include: assigning optimistic condition scores to existing habitats without supporting survey evidence, underestimating the area or condition of habitats being lost, and applying incorrect temporal discounts to new habitat types. Getting the baseline right – based on actual survey data rather than desktop assumption – is the foundation on which everything else rests.
Frequently Asked Questions
Do I need an ecologist to run the biodiversity metric?
For planning purposes, yes – the habitat baseline needs to be established through an on-site survey by a suitably qualified ecologist, and the condition assessments need to follow Natural England’s standardised methodology for each habitat type. The metric spreadsheet itself can be run by anyone, but the inputs are only as reliable as the survey data behind them. A metric calculation based on desktop assumptions rather than survey data is unlikely to be accepted by the local planning authority.
What happens if I can’t achieve 10% gain on-site?
Off-site biodiversity units can be purchased to make up the shortfall – either from a registered off-site habitat provider or, as a last resort, through statutory biodiversity credits from Natural England. The metric calculates the unit deficit, and the off-site provision needs to cover that deficit with the appropriate spatial risk multiplier applied. The hierarchy is on-site first, then off-site, then statutory credits – and statutory credits are priced to make on-site and off-site delivery more attractive.
Can the metric be gamed?
Not sustainably, no. Assigning inflated condition scores to habitats or underestimating baseline values will be challenged during the planning process. Local planning authority ecologists and Natural England are increasingly familiar with the metric and its common pressure points. A metric calculation that looks implausibly favourable will attract scrutiny. Getting it right from the outset is considerably less time-consuming than defending an optimistic calculation under challenge.
How often does the metric get updated?
Natural England updates the metric periodically – version 4.0 is current, having superseded earlier versions. When a new version is released, local planning authorities typically transition to requiring the new version after a defined period. Checking which version is required by the relevant LPA before commissioning a metric assessment avoids having to redo the calculation to a different version later. Natural England’s guidance documents confirm which version is current and when previous versions expire for planning purposes.
A Tool Worth Understanding
The biodiversity metric is not especially complicated once the underlying logic is clear. Area times distinctiveness times condition, adjusted for time and spatial risk. That framework produces a number that planning authorities can check, compare, and enforce against. It’s imperfect – no metric captures the full complexity of ecological value – but it’s consistent, transparent, and gives developers a clear target to work towards.
Understanding it well enough to have an informed conversation about site design options, habitat retention decisions, and the likely need for off-site units is genuinely useful. Leaving it entirely to the ecologist and receiving a number at the end of the process isn’t the best way to make design decisions that affect the BNG outcome. The earlier in the design process the metric is run, the more options remain open.
Killingley Insights is the editorial voice of NT Killingley Ltd, drawing on decades of experience in landscaping, environmental enhancements, and civil engineering projects across the UK.